

Highway DC Fast Charging Station Manufacturer in China
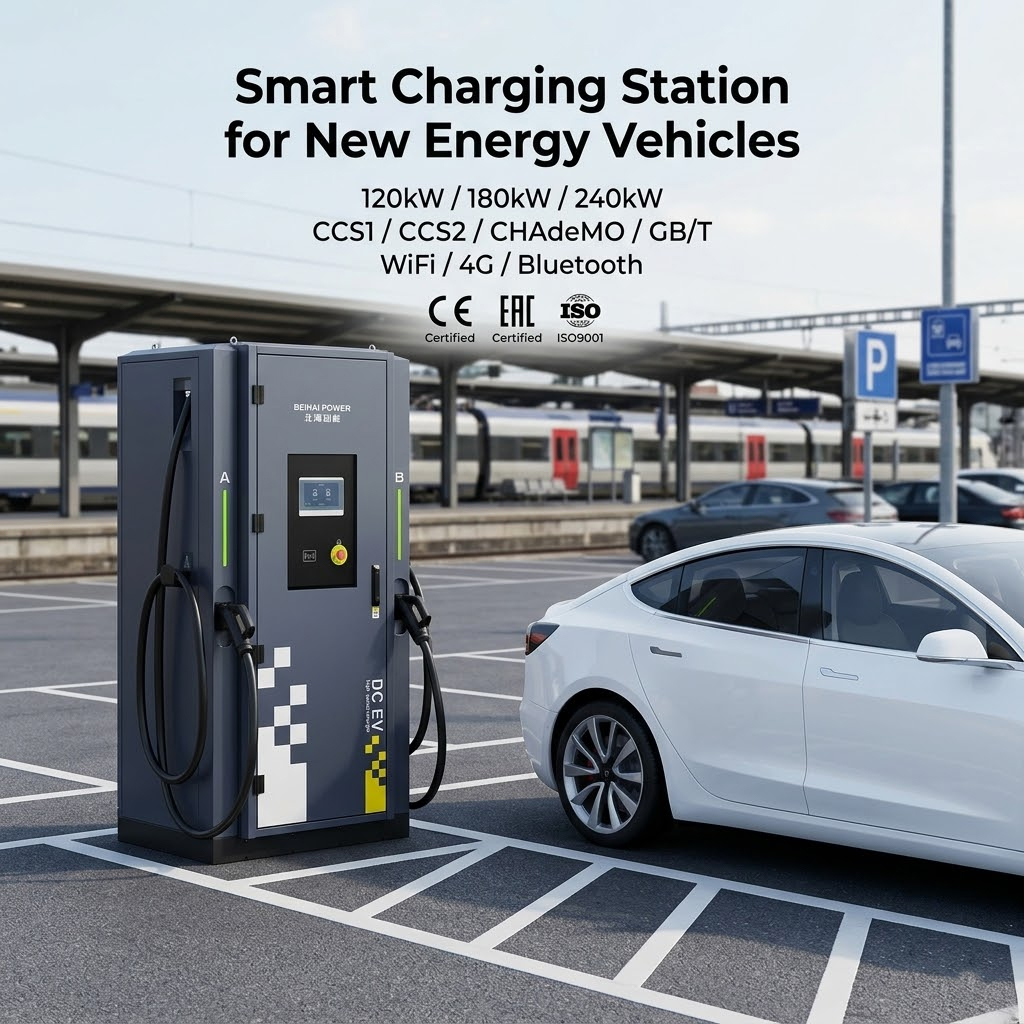
From our China-based factory, I design and supply a Highway DC Fast Charging Station that stands up to busy highway corridors, fleets, and service areas. As a China Manufacturer, I know what operators look for: reliability, modular expandability, and easy maintenance. The unit supports up to high-power charging with CCS2 and CHAdeMO, rugged enclosure, IP54 rated, with remote monitoring and OTA updates. It offers fast deployment with plug-and-charge, integrated cable management, and universal power input for different grids. I provide turnkey installation support, safety compliance, and spare parts backup across regions. For customers worried about uptime, our hot-swappable components and autonomous cooling keep stations online even in extreme weather. By choosing this Highway DC Fast Charging Station, you gain lower total cost of ownership and faster vehicle turnover, ideal for fleet operators and multi-site networks seeking a reliable partner.


Highway DC Fast Charging Station Industry Giant Sets the Industry Standard
As highway electrification accelerates, a global standard-setter in DC fast charging signals a turning point for buyers. When a leading player defines performance, safety, and interoperability benchmarks, operators can build scalable networks with cross-region compatibility and reduced risk. The emphasis on high-power delivery, robust safety, modular hardware, and durable outdoor cooling helps ensure uptime for travelers across climates and jurisdictions. Global procurement teams should translate these benchmarks into practical requirements: broad compatibility (multi-standard connectors), high uptime with redundant paths, modular, hot-swappable components, rugged outdoor enclosures, and strong remote monitoring. Seek open software interfaces, cybersecurity, clear service levels, and a global spare-parts network. Consider total cost of ownership through energy efficiency, dynamic load management, grid interconnection, and warranties. Standardization speeds rollout, lowers risk, and delivers a reliable charging experience at scale.
Highway DC Fast Charging Station Industry Giant Sets the Industry Standard
| Region | Market Segment | Total DCFC Ports | Avg Power per Charger (kW) | Max Charger Power (kW) | Stations | Year Established | Annual Throughput (MWh) | Uptime (Last Year) | Utilization Rate (Avg) | Grid Connection Type | Renewable Energy Share % |
|---|---|---|---|---|---|---|---|---|---|---|---|
| North America | Highway Corridor | 2400 | 150 | 350 | 160 | 2015 | 18000 | 99.5% | 6.2% | Dedicated Substation | 22% |
| Europe | Urban & Highway | 2100 | 180 | 350 | 140 | 2013 | 17000 | 99.7% | 6.8% | High-capacity grid | 28% |
| Asia-Pacific | Urban & Highway | 4200 | 200 | 350 | 320 | 2012 | 26000 | 99.3% | 7.5% | Substation + high-load feeders | 26% |
| Latin America | Highway & Local Streets | 500 | 140 | 350 | 60 | 2016 | 5300 | 98.9% | 5.5% | Shared feeder | 14% |
| Middle East & Africa | Highway Corridor | 600 | 160 | 350 | 75 | 2014 | 7000 | 99.0% | 4.9% | Dedicated feeder | 20% |
| Global | Global Aggregation | 12200 | 170 | 350 | 715 | 2010 | 76000 | 99.5% | 6.1% | Global interconnection | 24% |
Related Products
High-Speed Charging 120KW Electric Car Charger (CCS1,CCS2,GB/T) Versatile Compatibility Dual Charging Plug DC Fast Charging Stations
Read More


Highway DC Fast Charging Station Exceeds Industry Benchmarks More Than a Supplier - A Partner
Top Selling Products


- Related Blog
- Reviews

-

Phone
-

E-mail
-

Whatsapp
-

Top